Now there may be good reasons for this lack of CRM database functionality: I’m sure it isn’t easy to automate something like this; infographics are often an individualistic approach, almost an art form in their own right, and a database probably can’t produce such pictures in that way; infographics are dependent on the creator looking at the data and interpreting it in a way in which an automated system might not be able to; infographics may source data from multiple databases and data repositories; and so on.
But even with those caveats, surely it isn’t beyond the wit of extremely clever and bright designers and programmers to be able to create some form of infographic which could be automated from the database?
For instance, let’s take a comparatively straight forward fundraising income report. We know we can produce that from the database as a report or as pie chart/bar chart etc, but think of how interesting it would be, and the messages you could deliver, if that could be produced simply as an infographic.
And maybe that could be done like this: Maybe the database could have a selection of backgrounds which a user could choose (e.g. a collection box, a church, maybe a map or a selection of photos of people etc – or even an image which the user could upload, that would be even better); then a selection of icons which the user could select instead of the bar graph, different fonts and font sizes, boxes for free text and so on; and ideally let them move these items around on the page in some way. Thus, by combining these different factors, one could produce at least a few varieties of an infographic. Even better if they could then be exported in a format which could be imported into Photoshop or similar so the charity could make it a bit snazzier there.
Even that could give some charities without the skills or resources to create sophisticated infographics the ability to create some basic ones which might still look good on their web site for a particular campaign or in their annual report.
Or am I wrong? Do you use a database which can produce infographics direct from it? Or do you sell one? If so, let me know.
A Challenge to Fundraising & CRM Database Suppliers
But assuming not then… how about this as a bit of a challenge to the database suppliers out there?! Come on you software companies - what do you say?! Can any of you show me that you can produce infographics direct from your database? If you can then let me know and I may produce a follow-up post to this one with the best of them. And surely a good infographic has got to be good for your sales demos hasn’t it?!
Taking a leaf from David McCandless: let’s make things beautiful – even database output.
4 comments:
Ivan - maeking more use of infographics is something we should all aim it but direct from the CRM? CRM's are relational databases designed to suppport business processes and capture all the statis and transactional information you will ever need. This means you end up with data that in its raw form is not ready for BI reporting, so you transform your data before you report on it. This might be a catalog, datamart, or even a simple export. Even the newer BI tools like Qlikview which work directly with the CRM still require extensive analysis and script creation to prepare the data for reporting. Therefore settign the expectation of creatign infographics direct from CRM's is going to create another round of raising expectation and under delivering. Respectfully yours, halfglass Bagnall
Perhaps I'm being deliberately perverse (it wouldn't be the first time) but I'd take issue with you right from the start.
"Everyone loves a good infographic" - well, maybe. But from a data point of view, there are actually very few infographics out there which I would really describe as good. Far too often, they generate far more heat than light. In attempting to make information beautiful, it's very easy to simultaneously make it thoroughly misleading.
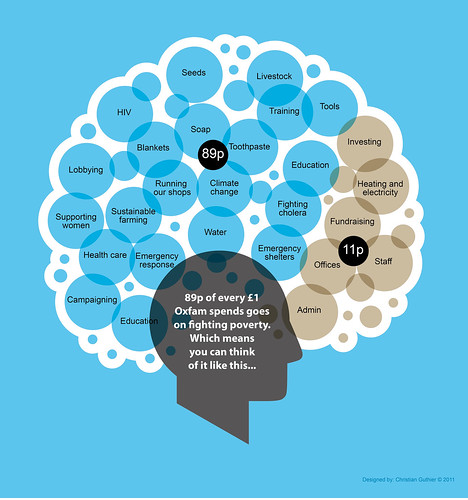
Take the Oxfam diagram that you lead with. It looks lovely. All those different sized circles representing the amount that's spent on different things - very interesting. Oh, hang on a minute - are Oxfam really spending the same amount on toothpaste that they do on water? Ah, I get it now - there's no point to the different sized circles as all the ones with words in are all the same size anyway. Not obvious at first glance. And since when does "running our shops" count as part of the spend on "fighting poverty". Are Oxfam trying to claim that their charity shops on the high street are there to fight poverty (presumably by allowing people to buy clothes cheaply) rather than as a revenue generating mechanism?
Have a look at this link - http://www.smashingmagazine.com/2010/05/10/imagine-a-pie-chart-stomping-on-an-infographic-forever/ - for many more examples of bad infographics and more importantly for a discussion of the need to understand data "body, mind and soul" before even trying to infograph it.
Oh, and I hadn't even spotted that the proportions of the "brain cloud" in the two different colours are nowhere close to being 89% and 11%!
Hi,
Thanks for the mention (and sorry not to have seen this sooner) - and challenge accepted! In fact the blog post you linked to was a screen-shot of an infographic that's generated by Lamplight from the built-in reports. It really is a few clicks. I have to say we don't really share Charles's doubts.
We're really interested in how systems can make data accessible, and help generate insights beyond averages and bar charts. We see it first of all as a means for the organisation to explore and understand their data, rather than an external communication tool.
But Simon's point is absolutely right: they've got to be accurate, and still need a person on the end of them to think about it. Although of course that applies to any stats, however they're presented.
Matt Parker
Post a Comment